Follow the timeline below to see what projects we've been working on, and how it all started,
Using smart meter data
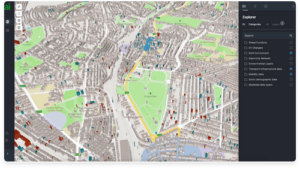
We are working as part of a consortium to address the trustworthy use of smart meter data within the UK energy system.
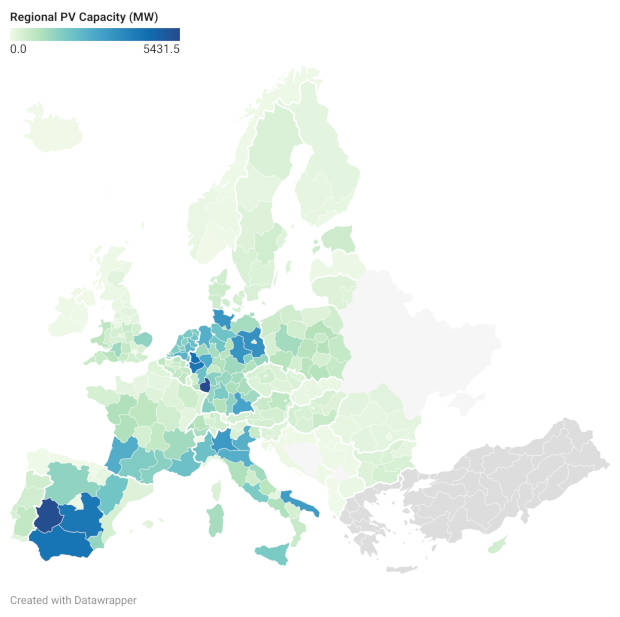
PV_Live EU
Working with Advanced Infrastructure Technology and funded under the C-ZERO project we’ve developed a European version of PV Live capable of providing half hourly outturns at NUTS 3 level. To request a demo account on our API please contact us.
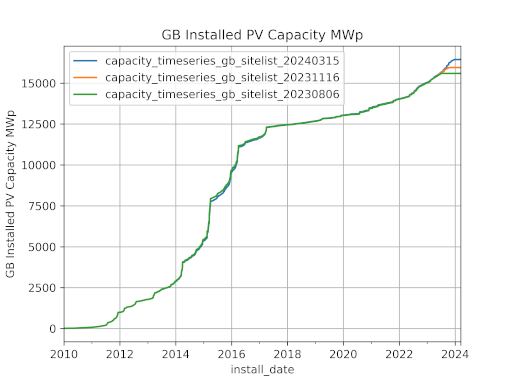
PV capacity reporting (GB)
PV capacity reporting becomes routinely released on a quarterly basis using capacity updates from Solar Media, the Renewable Energy Planning Database (REPD), the Feed-in Tariffs (FIT) database and the Microgeneration Certification Scheme (MCS). We apply cross referencing and validation tools to ensure there is no duplication of capacity amongst the different sources and that the final solar site list is as accurate as possible. Capacity is released at national and regional level.
Machine learning models for electricity demand
We are continuing to work with Advanced Infrastructure Technology to further develop our machine learning models for electricity demand under the Department for Energy Security and Net Zero Energy Entrepreneurs Fund.
![]()
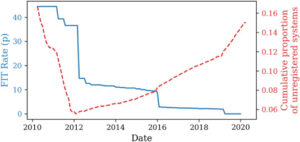
Uncertainty in PV capacity estimates
PhD candidate Owen Huxley and the PV Live team have published a key paper analysing the uncertainty in PV capacity estimates in Great Britain. PV capacity is a key dataset in the estimation of PV outturn and the paper allows an overall calculation of the error on half hourly PV outturn.
Electricity demand modelling
We won funding as part of the Modernising Energy Data Applications competition working with Advanced Infrastructure Technology Ltd to develop a proof of concept machine learning model for electricity demand to support decision making in local area energy planning.
PV_Live transitions to "Business as Usual"
National Grid ESO (now NESO) begin procuring the PV Live service on a commercial basis, ensuring it remains freely available to all stakeholders in the GB Energy Industry.
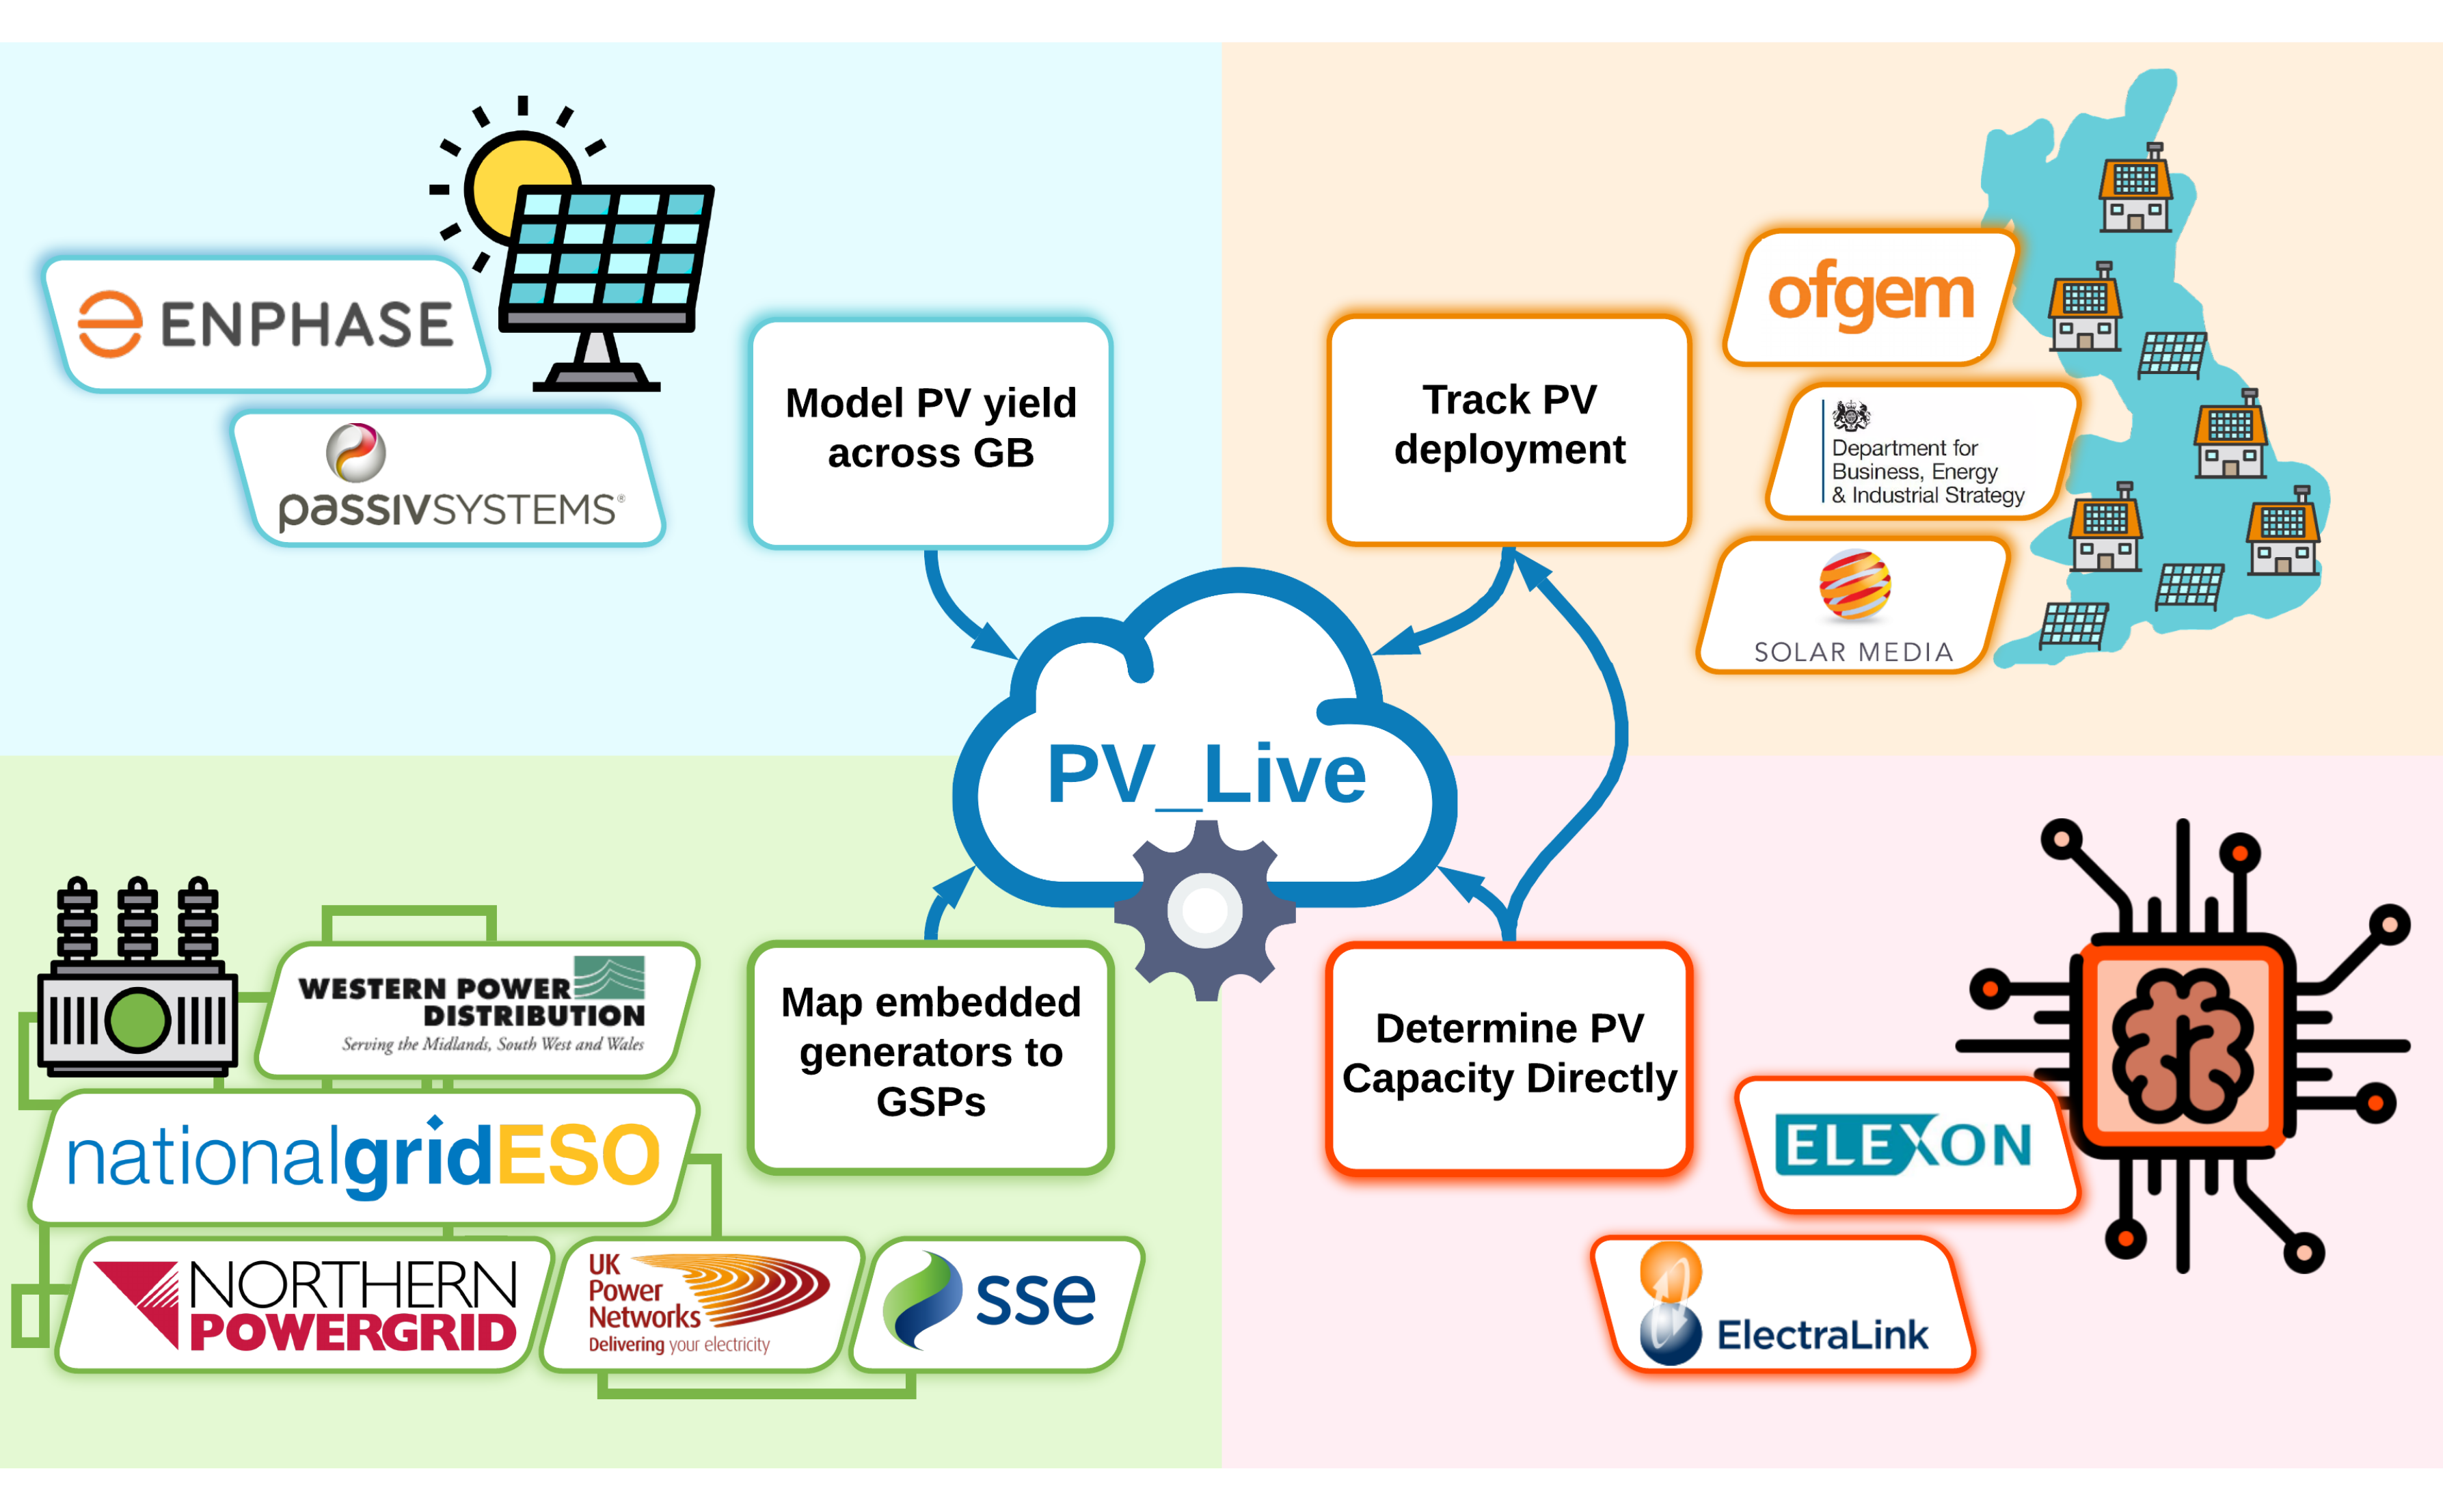
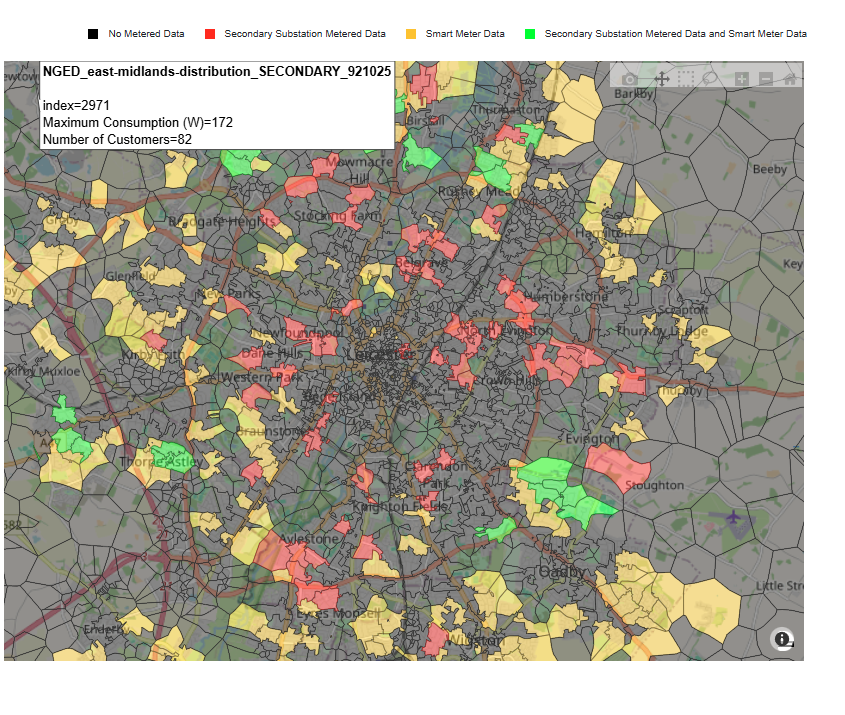
Working with National Grid ESO
We embarked on a second innovation project with National Grid ESO (now NESO), ‘PV Monitoring Phase 3’ funded by the Network Innovation Allowance. The project aimed to augment the PV_Live methodology in order to provide 5 minutely outturn estimates in near-real-time; to improve the accuracy of the regional PV outturn estimates through better mapping of the electricity network; and to develop a methodology for estimating the deployed PV capacity using metered demand data and modelled PV yield.
![]()
PV_Forecast
A GB solar forecast tool is released. In collaboration with MeteoGroup and PassivSystems, we developed a machine learning methodology for forecasting the GB PV outturn, based on site-level data and employing Numerical Weather Predictions. The forecast is available as a commercial service.
![]()
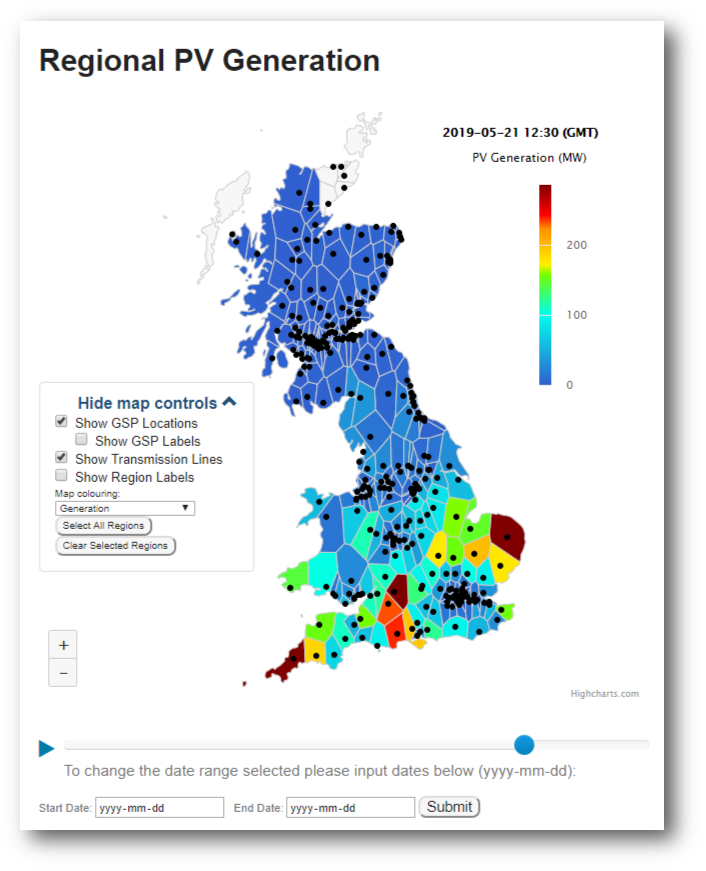
Regional PV_Live
Regional PV_Live provides PV outturns for each of the Grid Supply Points on the GB transmission network. The data can be accessed via API or visualised on our website.
Collaboration with National Grid ESO
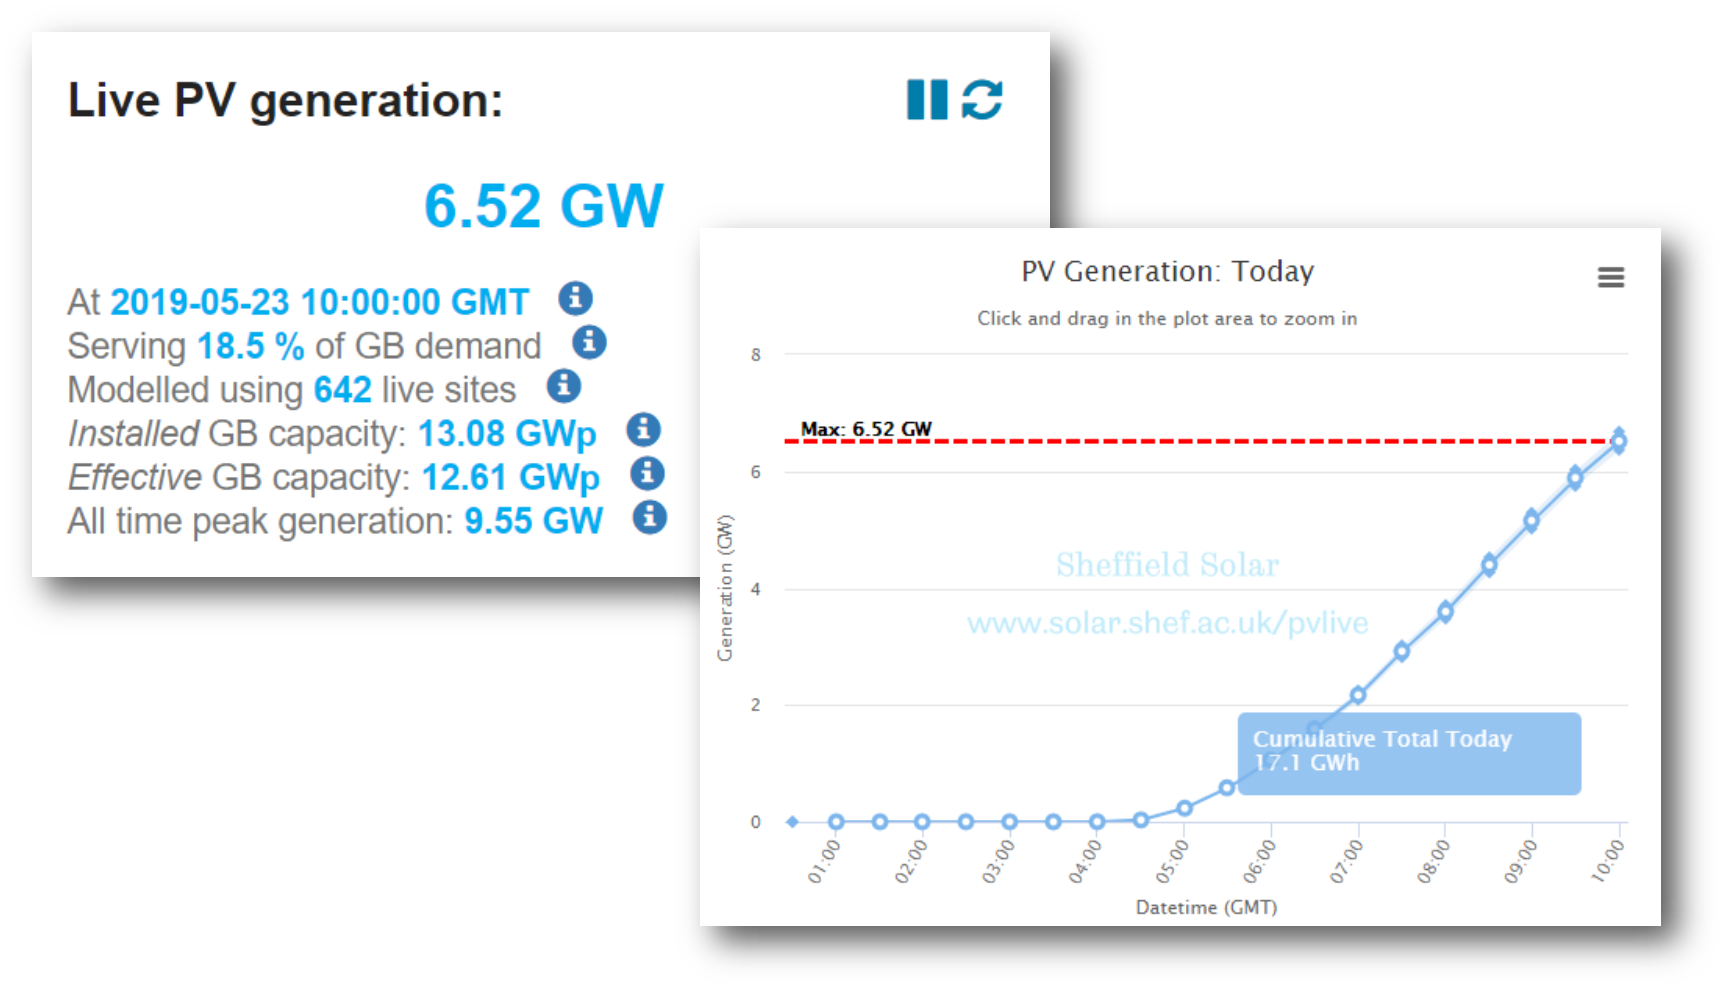
Start of a 2 year collaboration project ‘PV Monitoring Phase 2’ with National Grid ESO (now NESO) funded by the Network Innovation Allowance. The project set out to develop a methodology for monitoring the national and regional outturn from GB solar in near-real-time and historically.
![]()
PV_Profiler
Using data from the Microgen Database we estimate the potential generation from a PV system on a monthly and annual basis. It compared data from surrounding operational systems with that from an established tool.
Researching UK PV Performance
Between 2011 and 2015 we continued to develop the Microgen Database and use the data collected to fuel our research into real-world performance of PV in the UK.
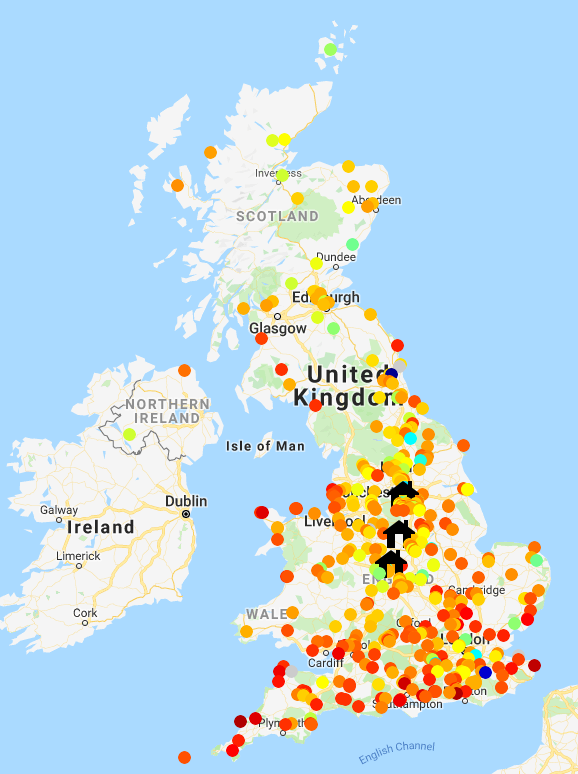
Microgen Database
PV generation data is crowd-sourced via the Microgen Database to expand our research into the characterisation and modelling of PV performance in the UK.
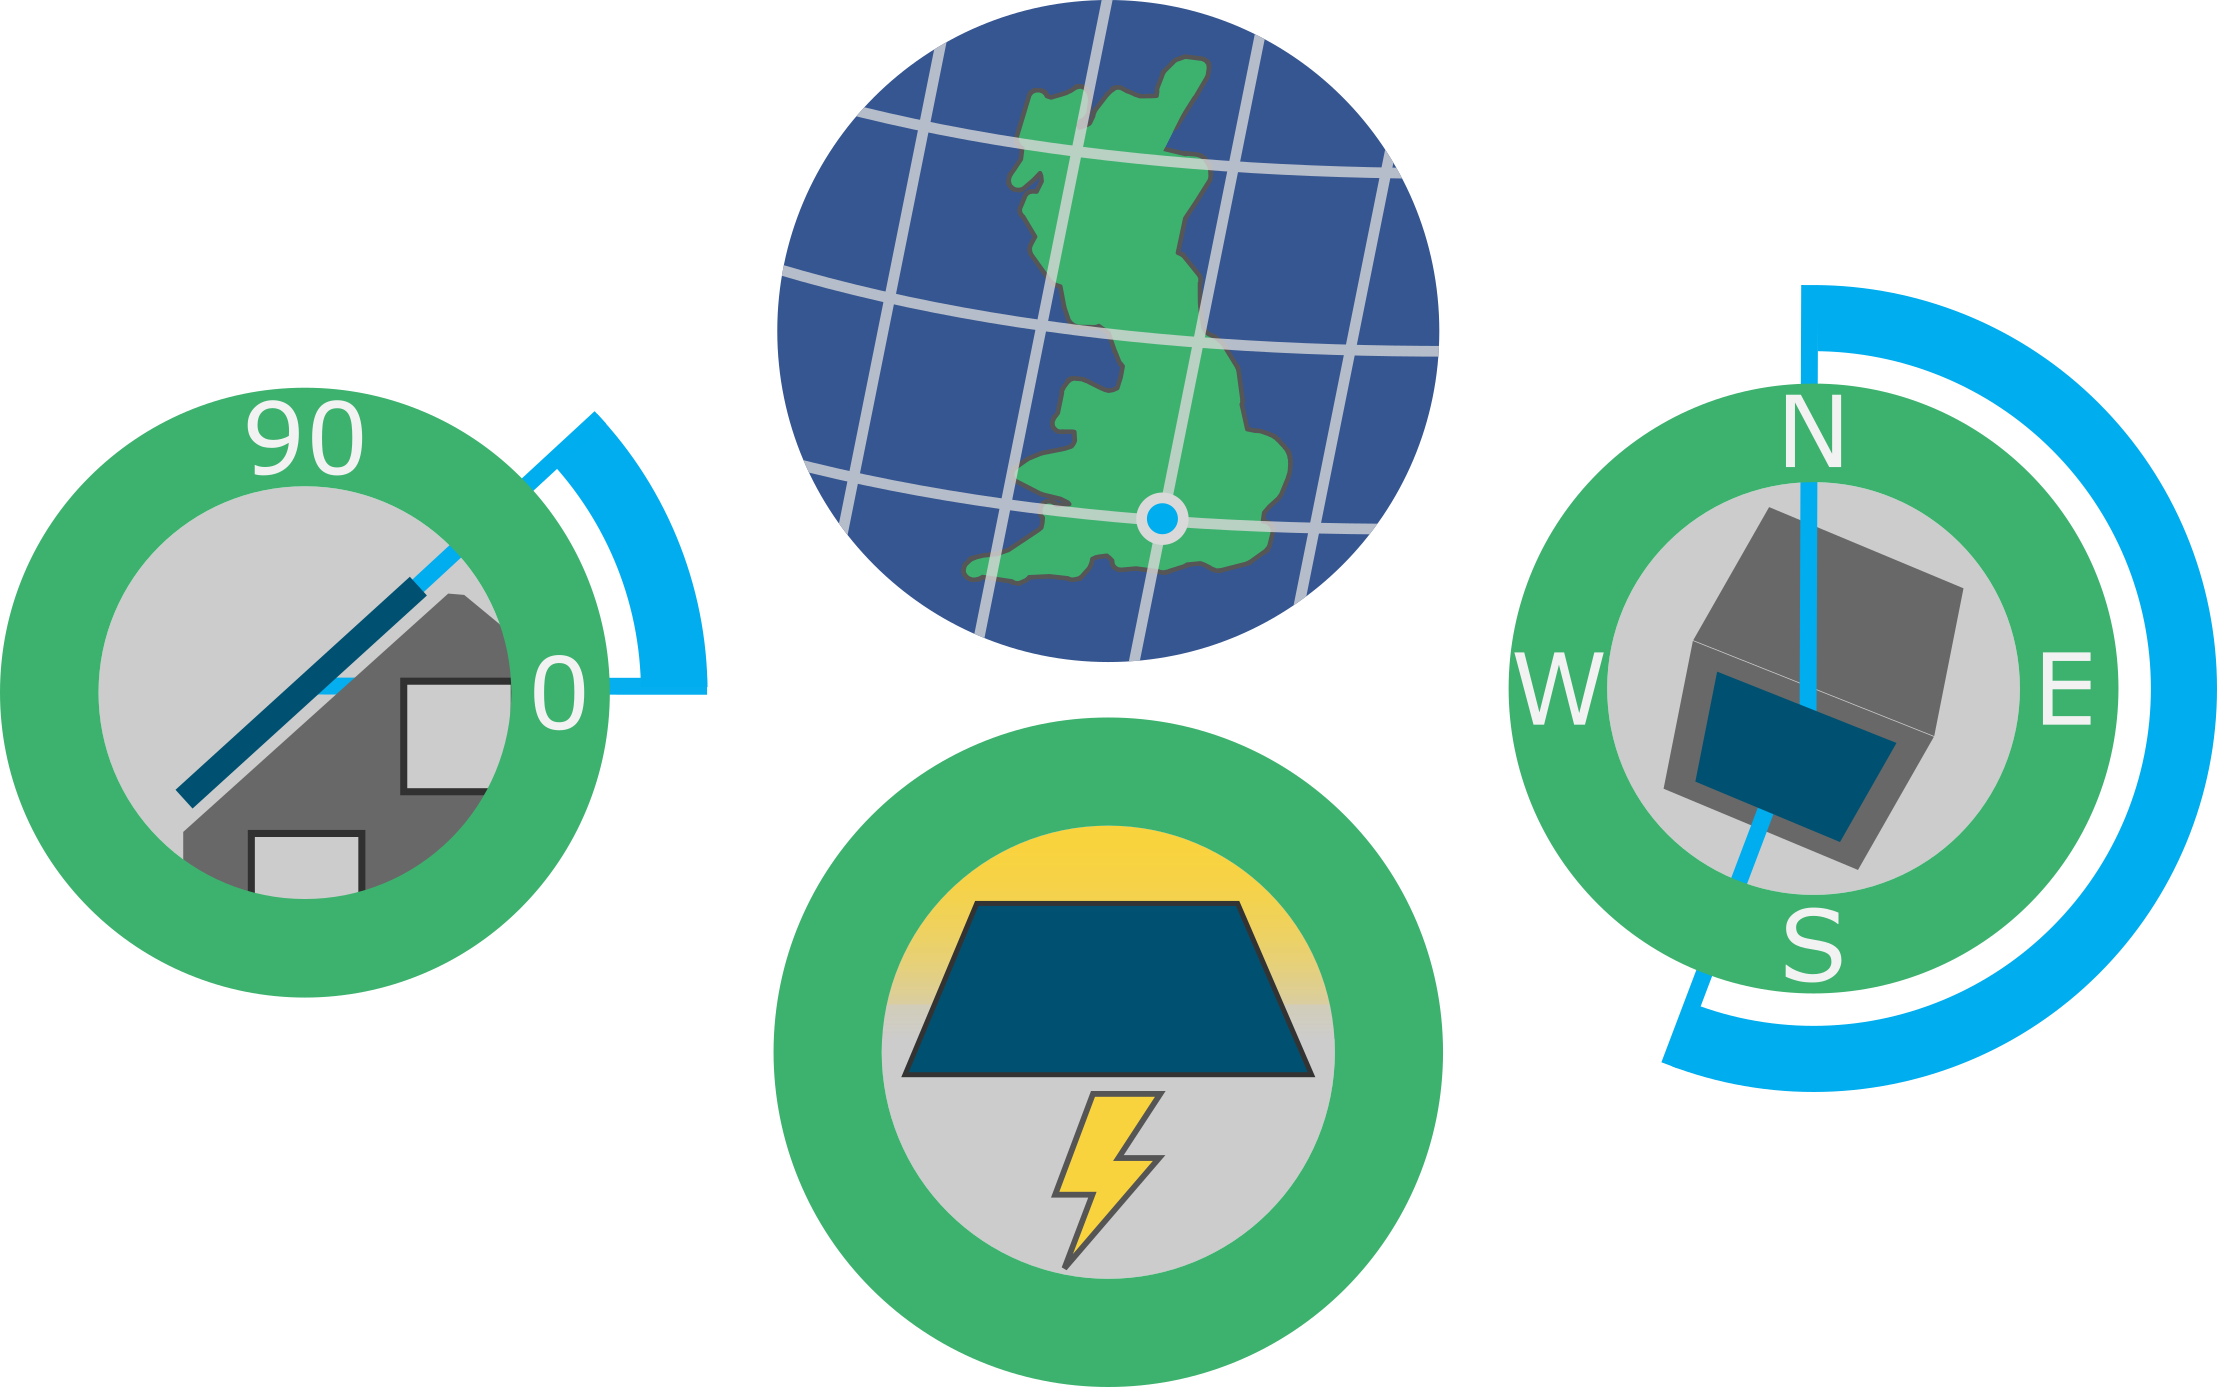
Testbed
Our earliest work focused on comparisons of emerging solar PV technologies and how they perform in the UK climate specifically. We installed a PV testbed on the roof of the Hicks Building in Sheffield and began to study the generation and performance from new and disruptive alongside established PV technologies.
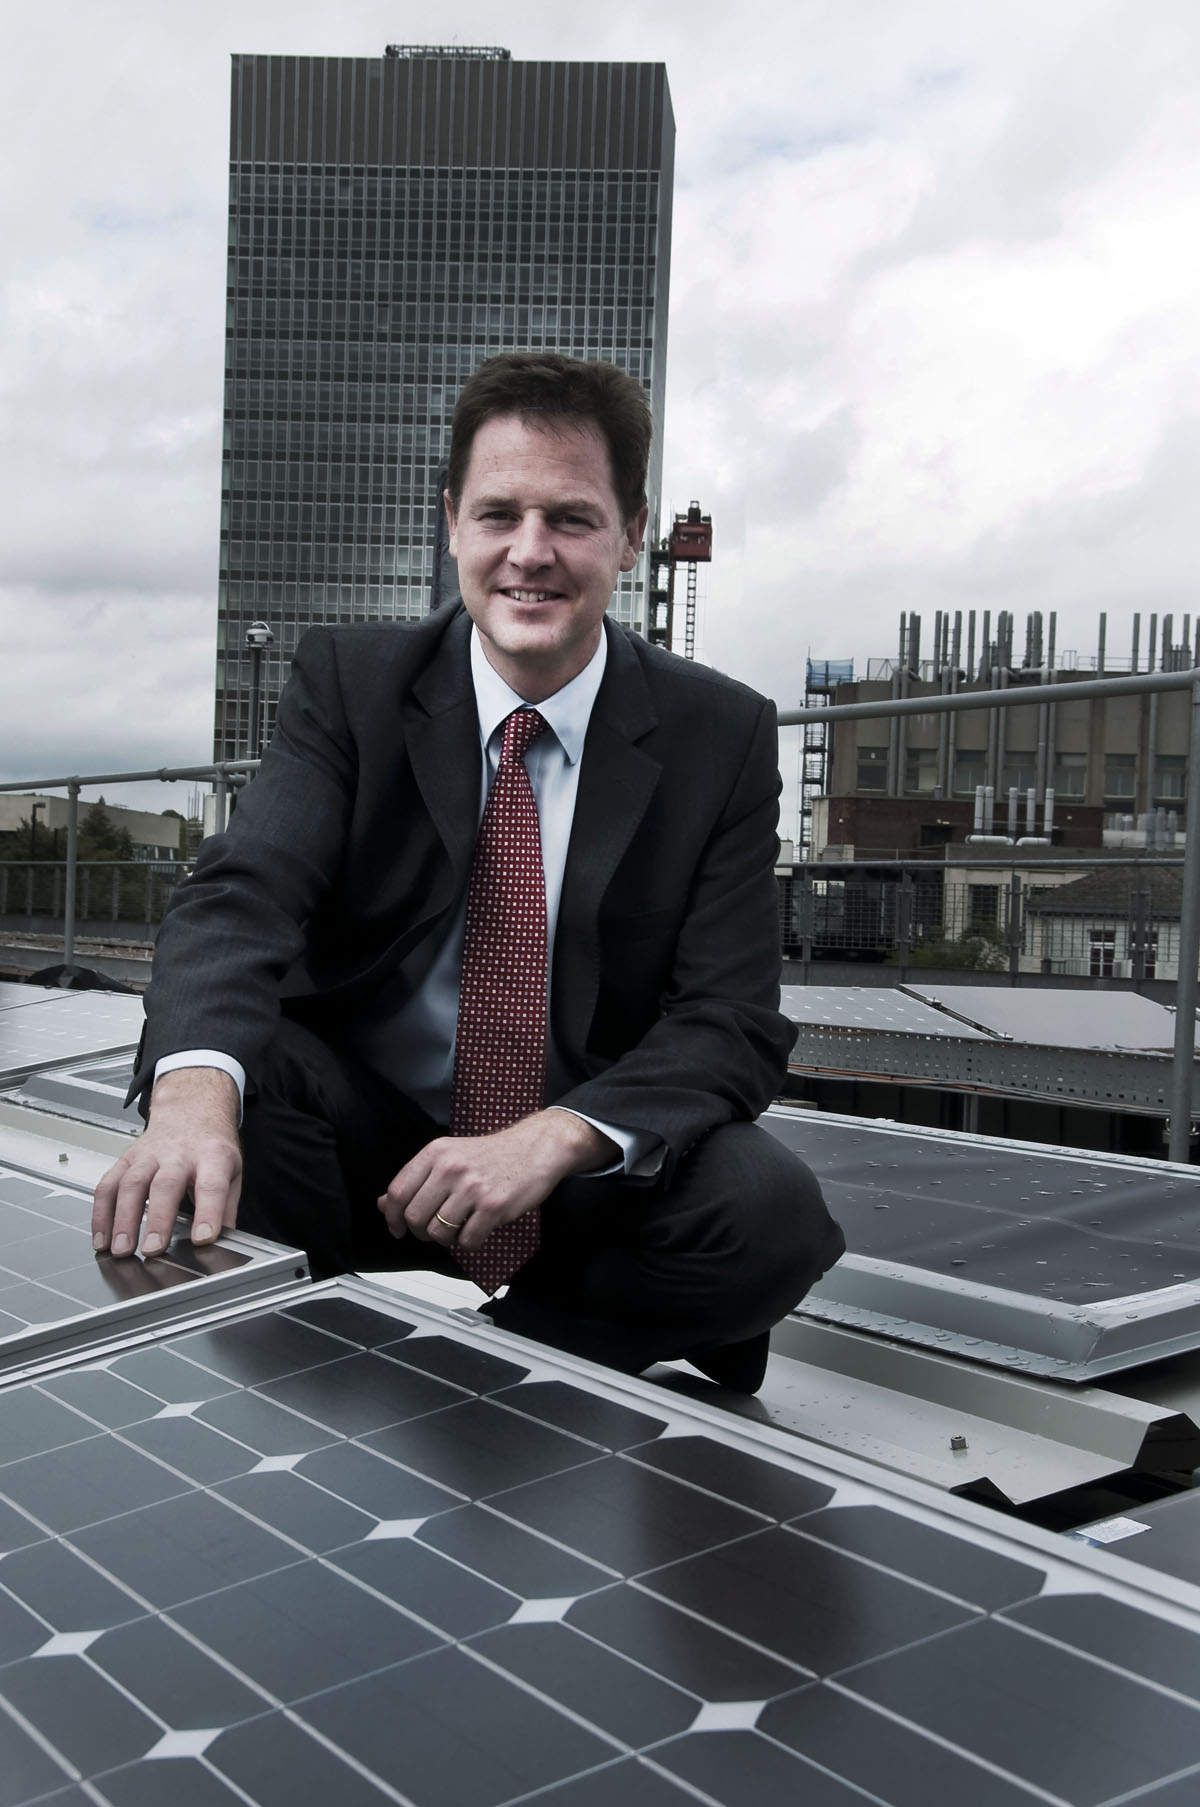
Nick
Clegg (then Deputy PM) at our testbed launch event 20/08/2010
Sheffield Solar Launches
The Sheffield Solar research group is formed in the University of Sheffield's Physics & Astronomy department, as part of the Grantham Centre for Sustainable Futures. It works to bridge the gap between the research lab and how solar photovoltaic (PV) technology is used in the real world and to understand its performance and impact.